The Performance Addict's Toolbox
Peter Steinbach
steinbach@scionics.de
Nov 10, 2017, MeetingC++ 2017, Berlin
as simple as this
more like this

Who am I?

Scionics Computer Innovation GmbH
- software and consulting company
- founded in 2001 in Dresden, Germany
- expertise in data analysis, bioinformatics, image analysis, HPC, ...
Our Client
- 500+ staff
- my role: Scientific Software Engineer
- support users on our HPC infrastructure
- software projects related to performance (think multi-threaded, GPUs, ..)
Disclaimer

Before I begin

All of my slides assume, that the code provides correct results!
Nobody wants fast code, that is wrong!
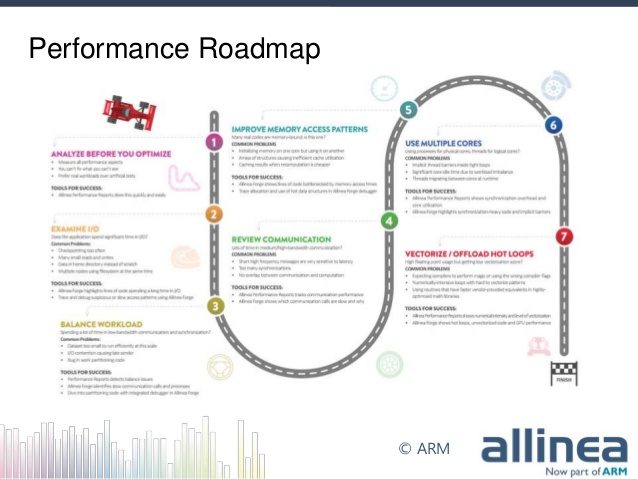
One day as a Performance Engineer

High Level Overview
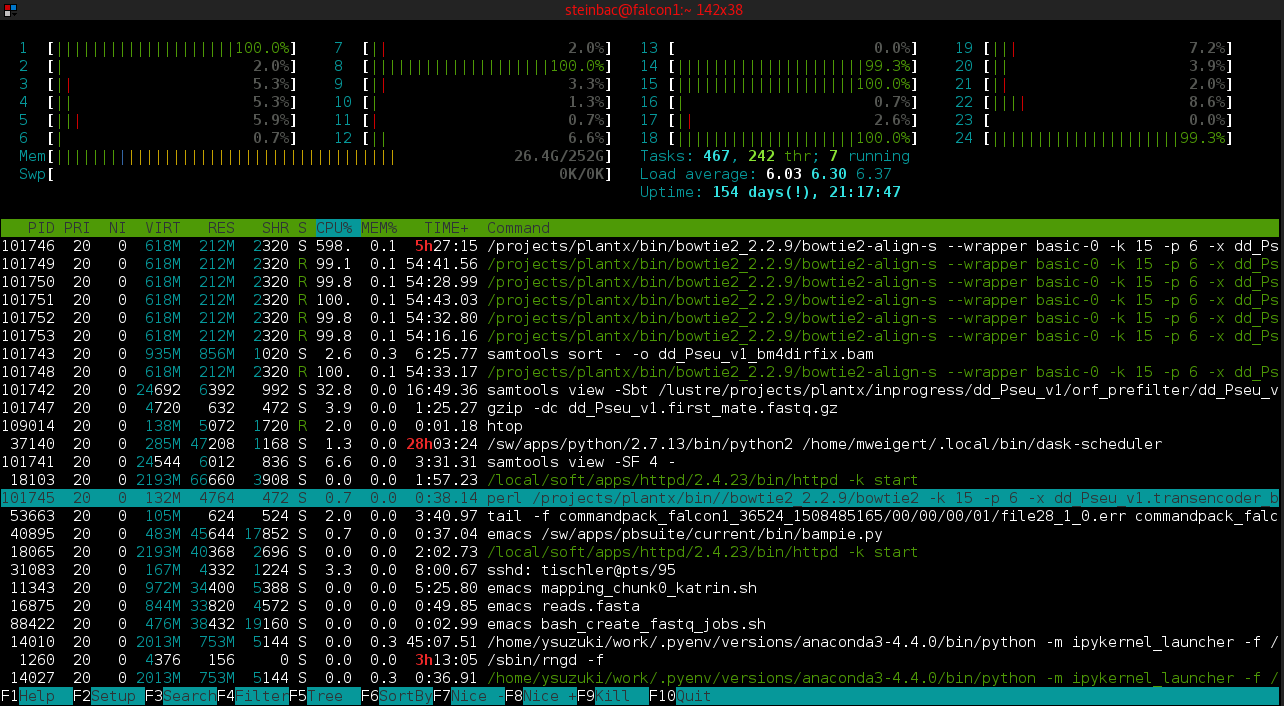
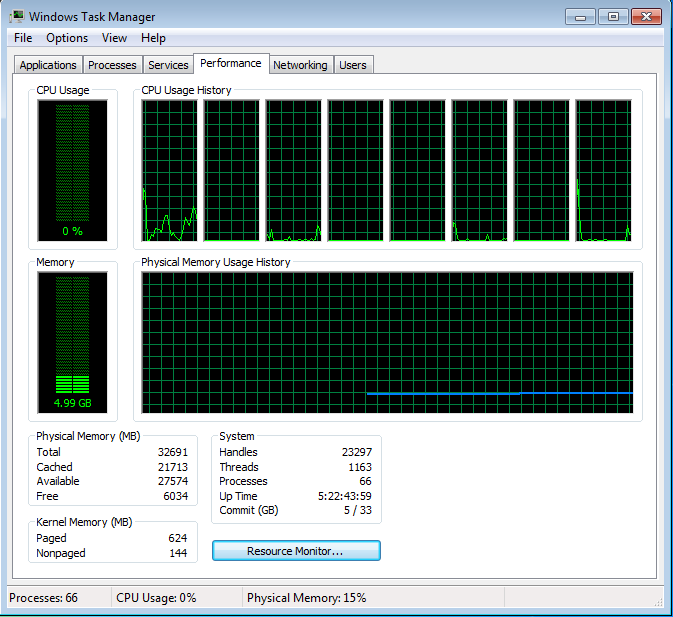
Simple Graphical output, perftools
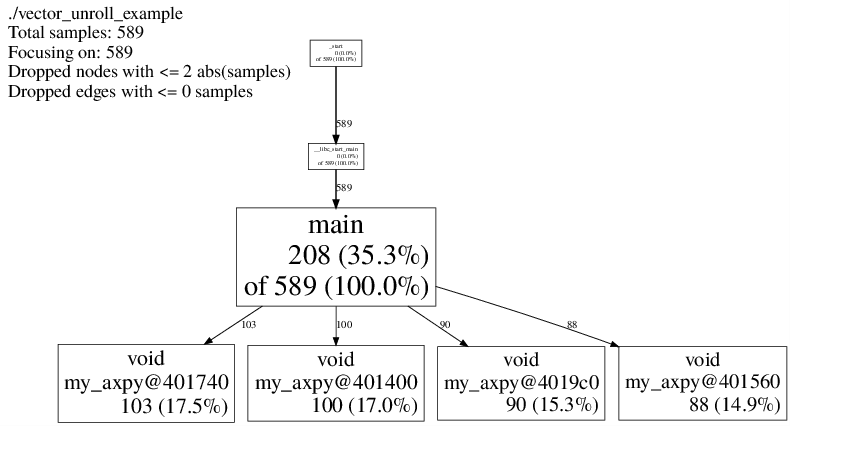
Profile from Peter Gottschling's example on vector unrolling.
valgrind + kcachegrind
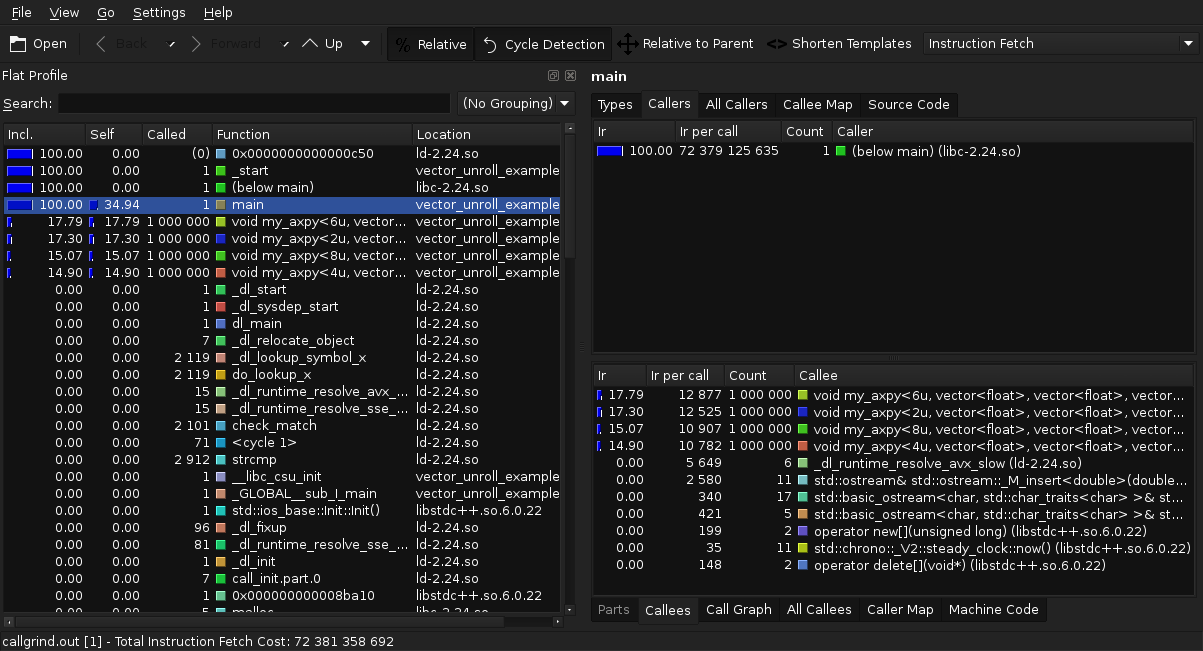
Profile from Peter Gottschling's example on vector unrolling.
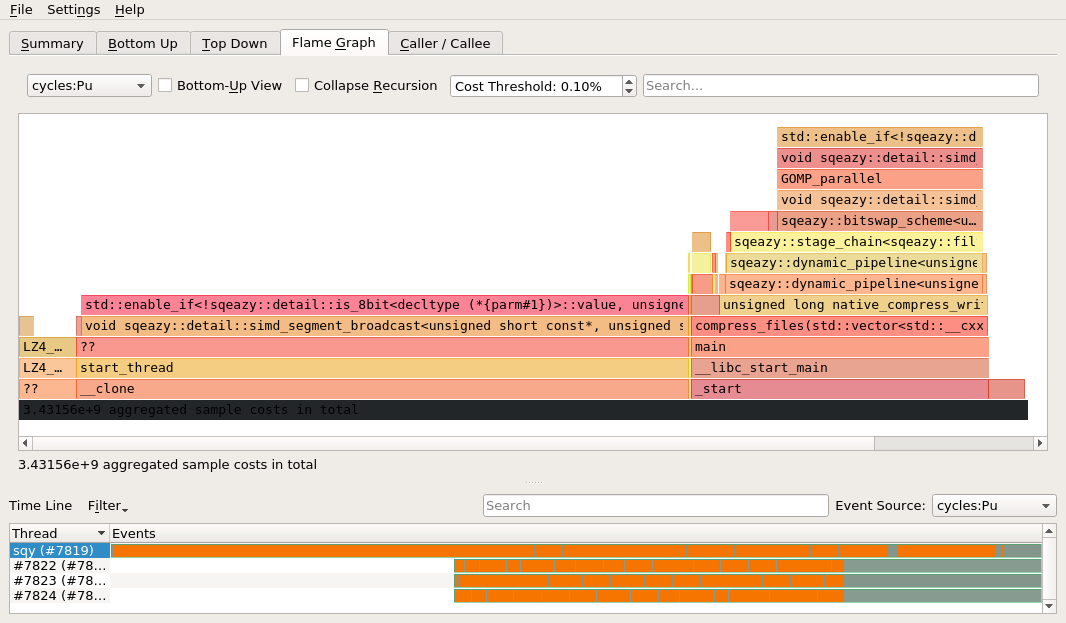
Using flamegraphs, hotspot
Proprietary tools
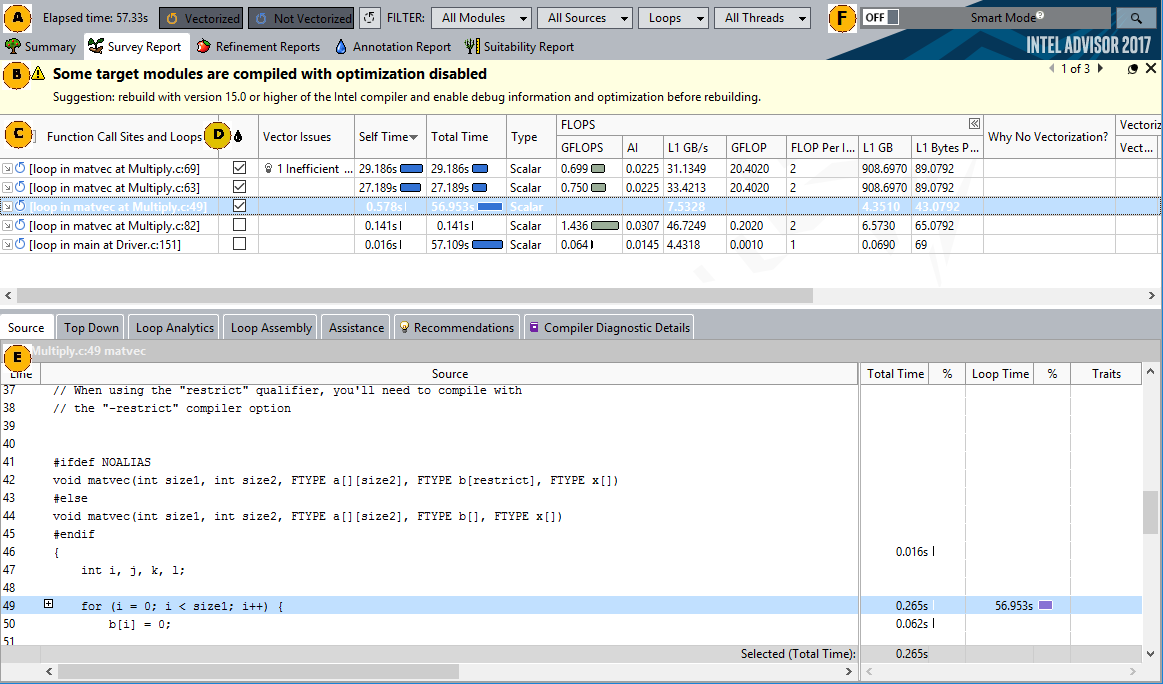
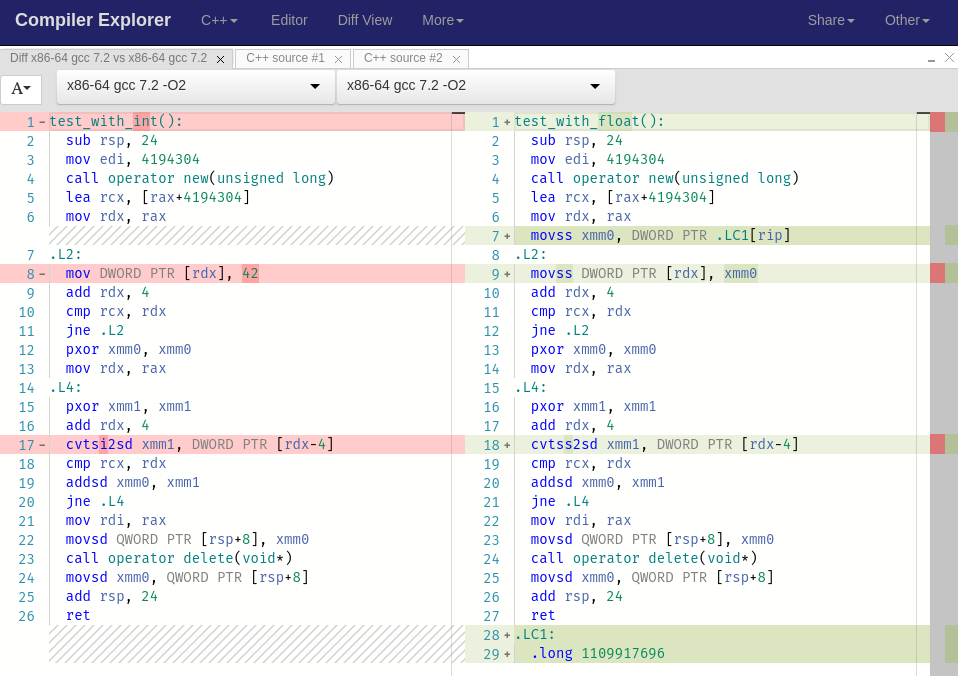
Inspect Assembly?
Test hypothesis with likwid
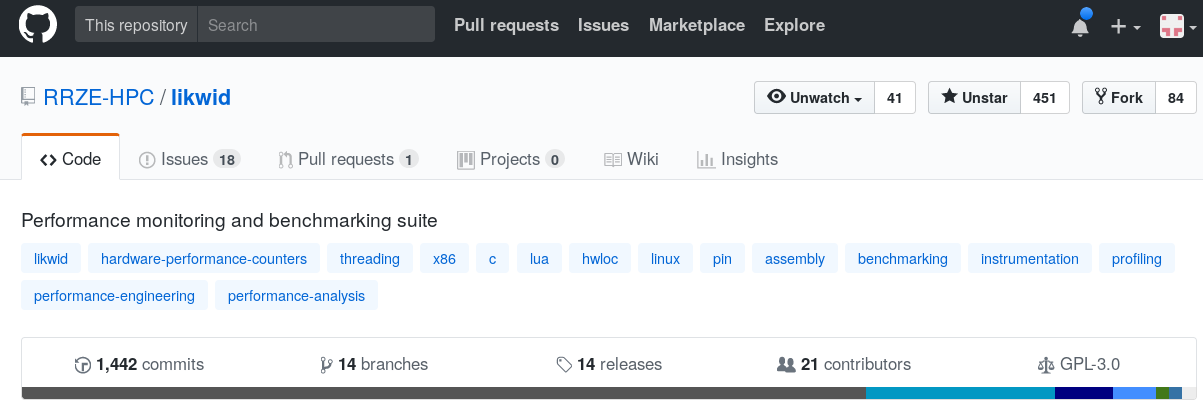
- github.com/RRZE-HPC/likwid
- open source Performance monitoring and benchmarking suite
- Linux only
- profiling through hardware counters (consistent meta markers for portability)
- exploration through monitoring
- marker API for C, C++, java and python
Bottom Line
- excellent tools available to find hot spots
- once "found", talk to someone
(rubber duck or colleaque(s)) - create falsifiable hypotheses
- MEASURE!
Life as a reviewer
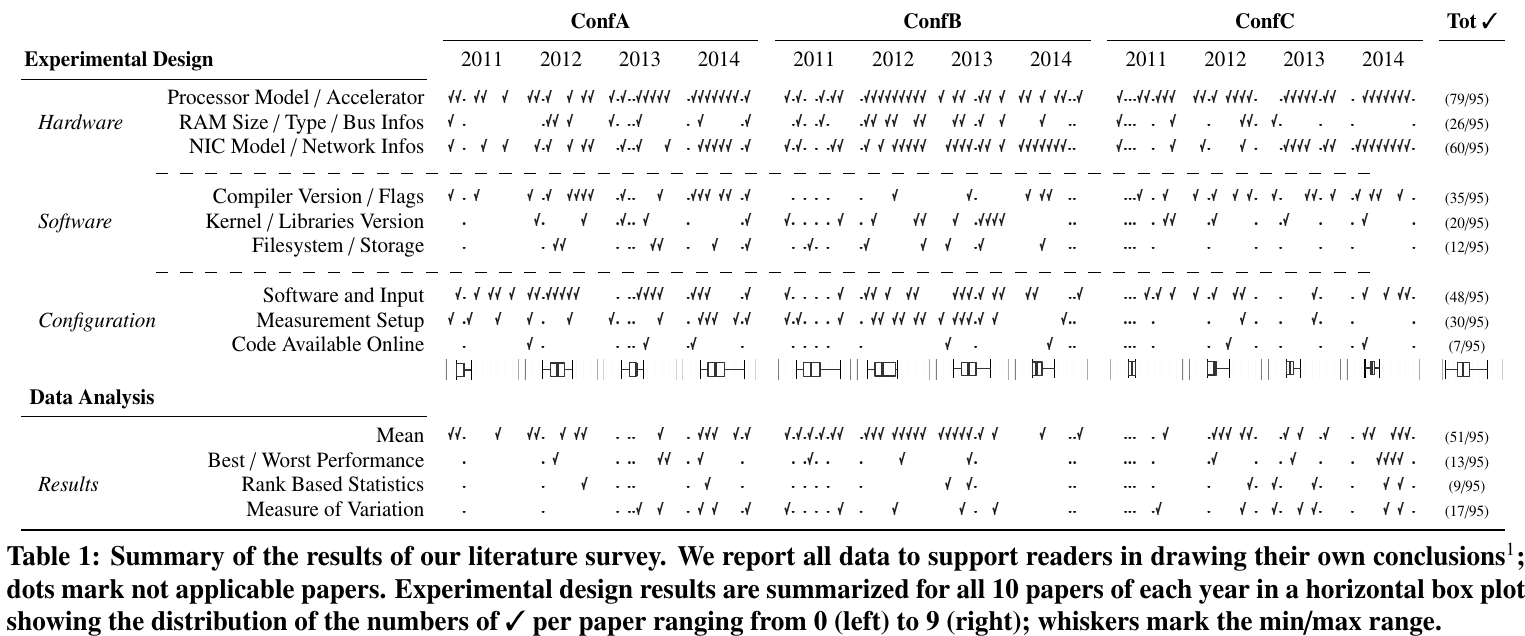
T. Hoefler et al, "Scientific Benchmarking of Parallel Computing Systems - Twelve ways to tell the masses when reporting performance results",
SC '15 Proceedings, 2015
Let's take a toy example
... what if
Standardized, easy-to-parse output!
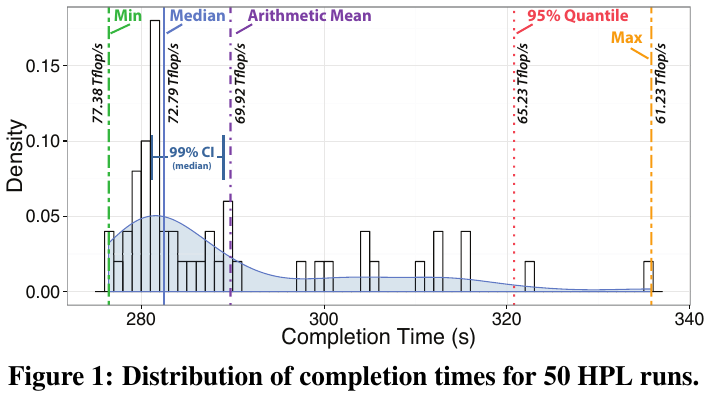
T. Hoefler et al, "Scientific Benchmarking of Parallel Computing Systems - Twelve ways to tell the masses when reporting performance results",
SC '15 Proceedings, 2015
Can't this be automated?
google/benchmark
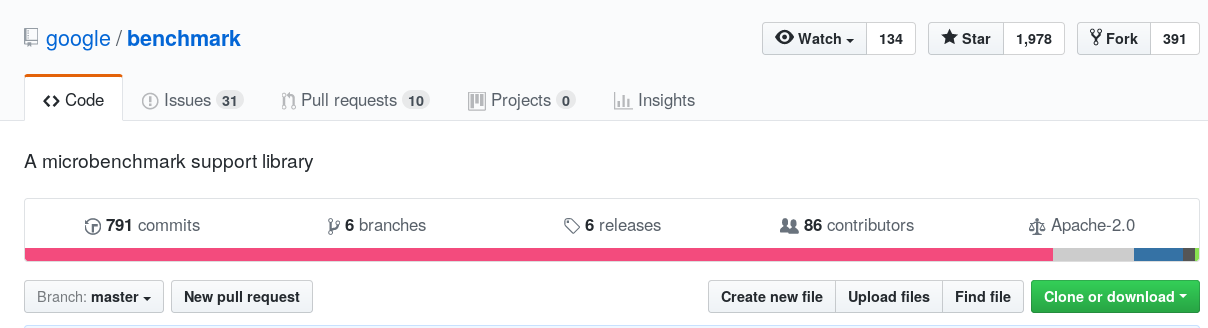
- written in C++11/C++03
- support of multi-threaded applications
- powerful CLI
- easy setup of (templated) test cases
- flexible argument control
- custom counters/timers
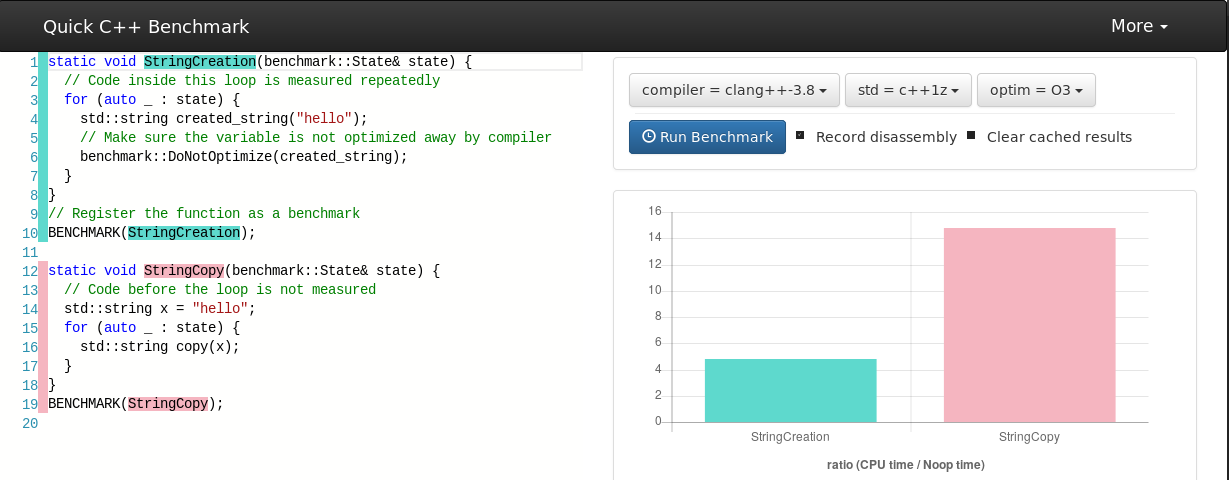
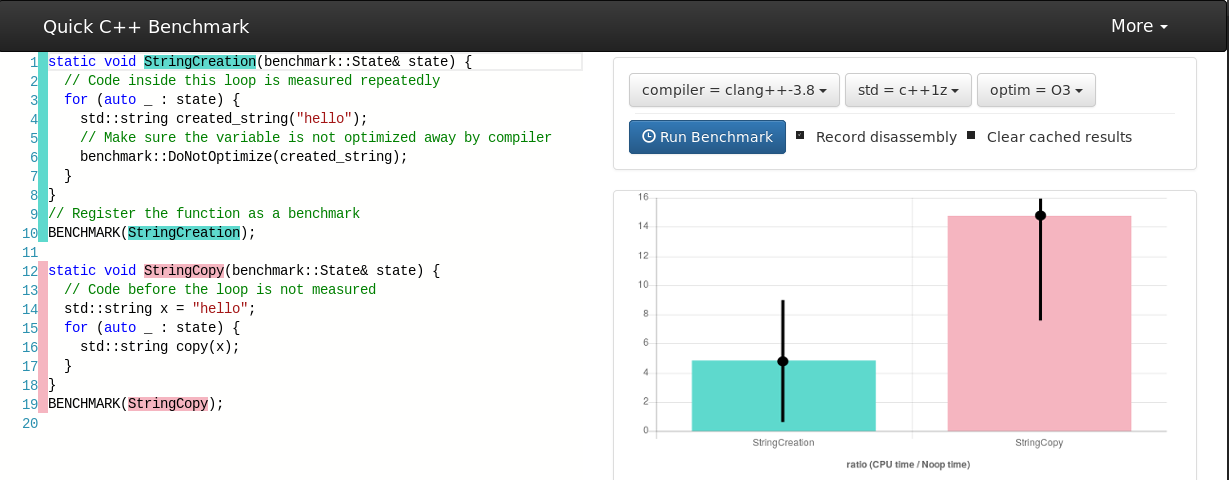
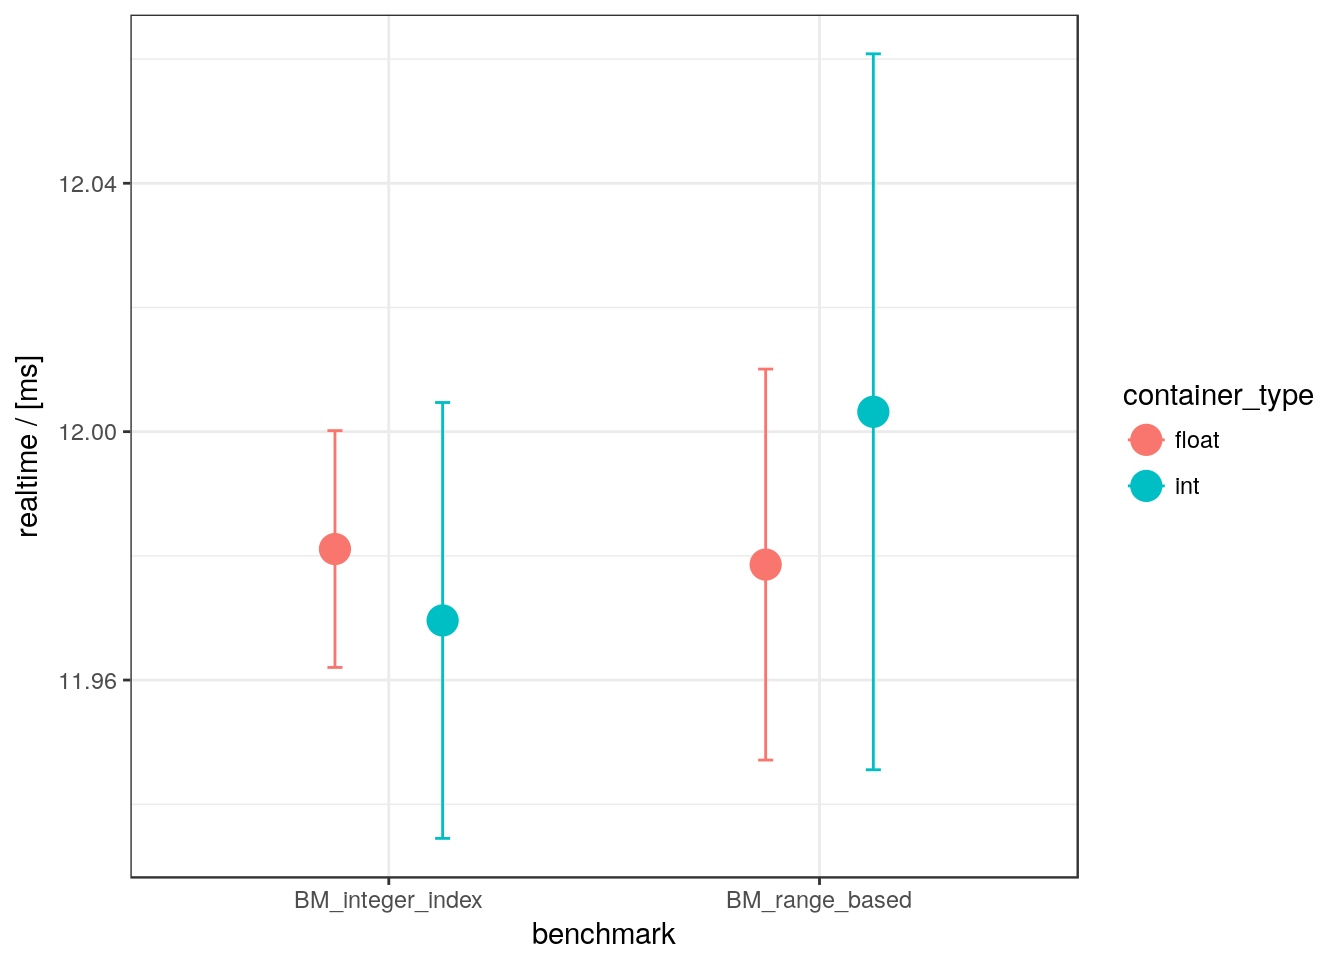
benchmark: in action
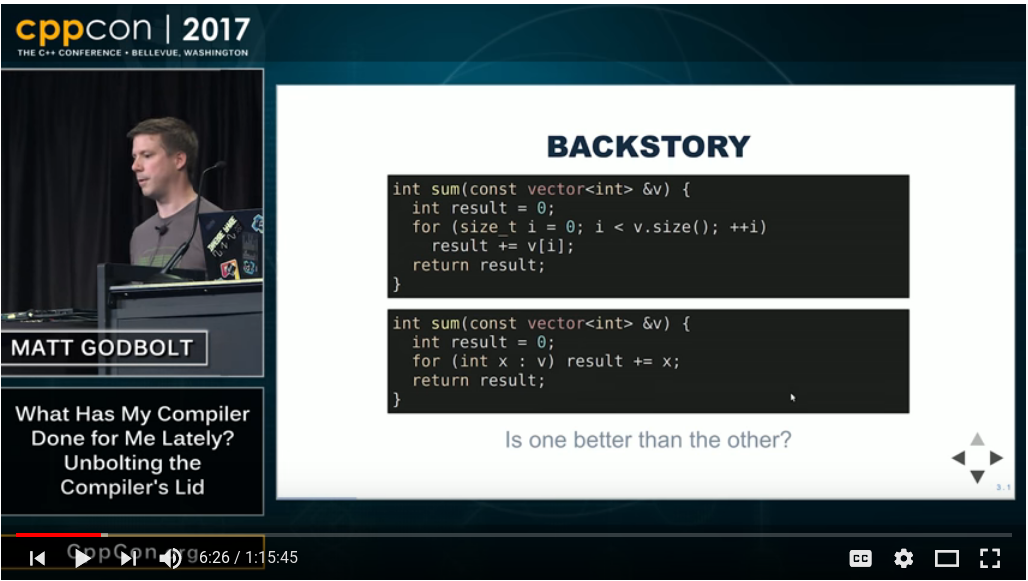
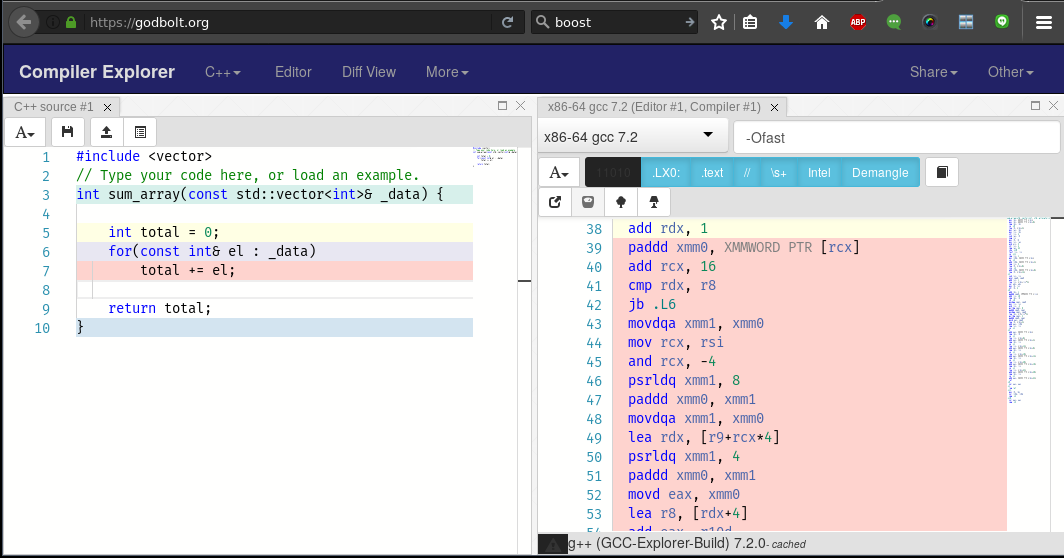
Question:
Are range-based for loops faster than integer based ones depending on the data type used?
benchmark: reproduce this!
code available in this repo
- file an issue if you reproduced this!
$ cd src/libbenchmark
$ //install libbenchmark & tidyverse R package
$ CXXFLAGS=-O2 make reportroofline
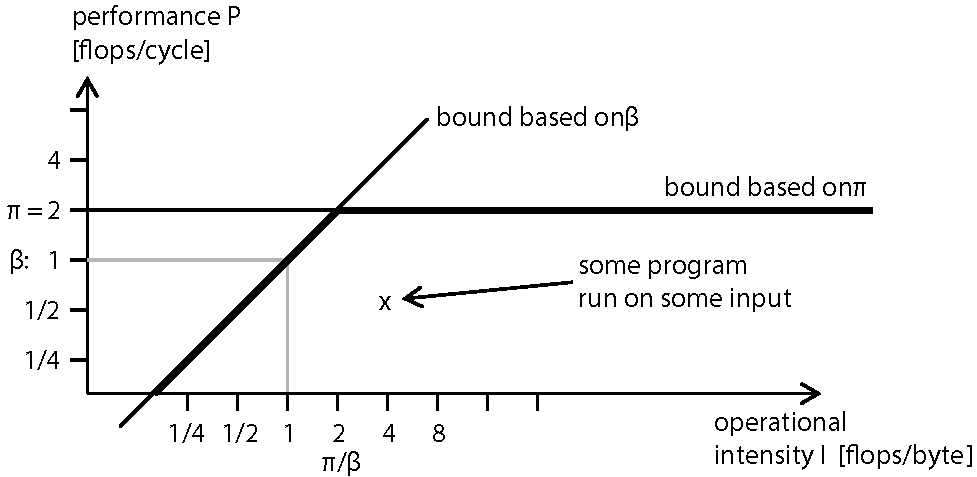
- acknowledge boundaries of algorithm
- differentiate "work" versus "traffic"
- simplistic: bottleneck is either work or traffic
- cache effects problematic
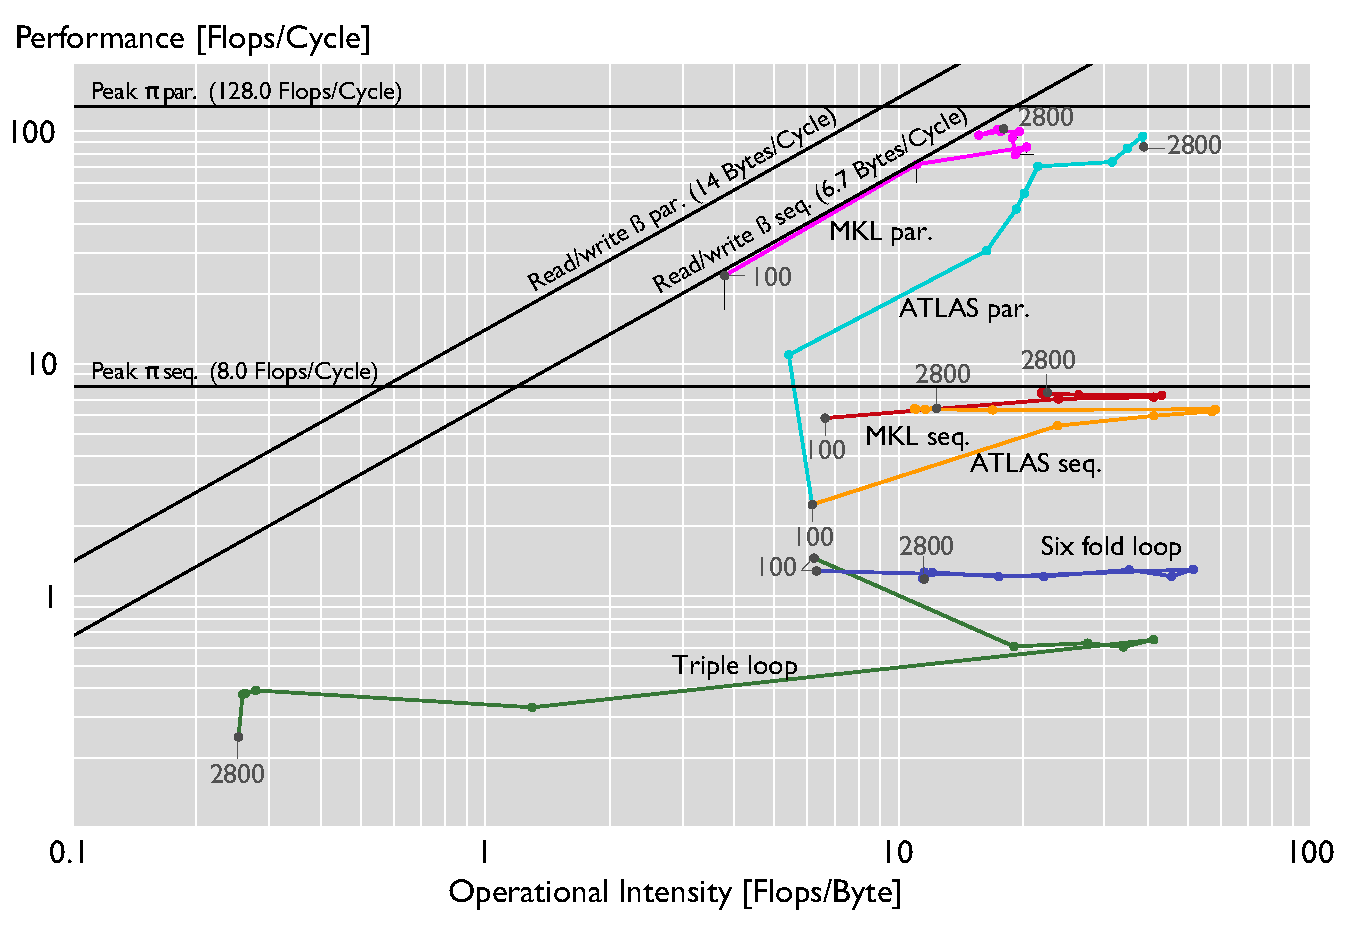
roofline in action
- clear indication where optimisations go
- can be used to give estimates on performance improvements (say on new hardware)
- typically used for floating-point heavy applications
- interesting mental model
roofline for real
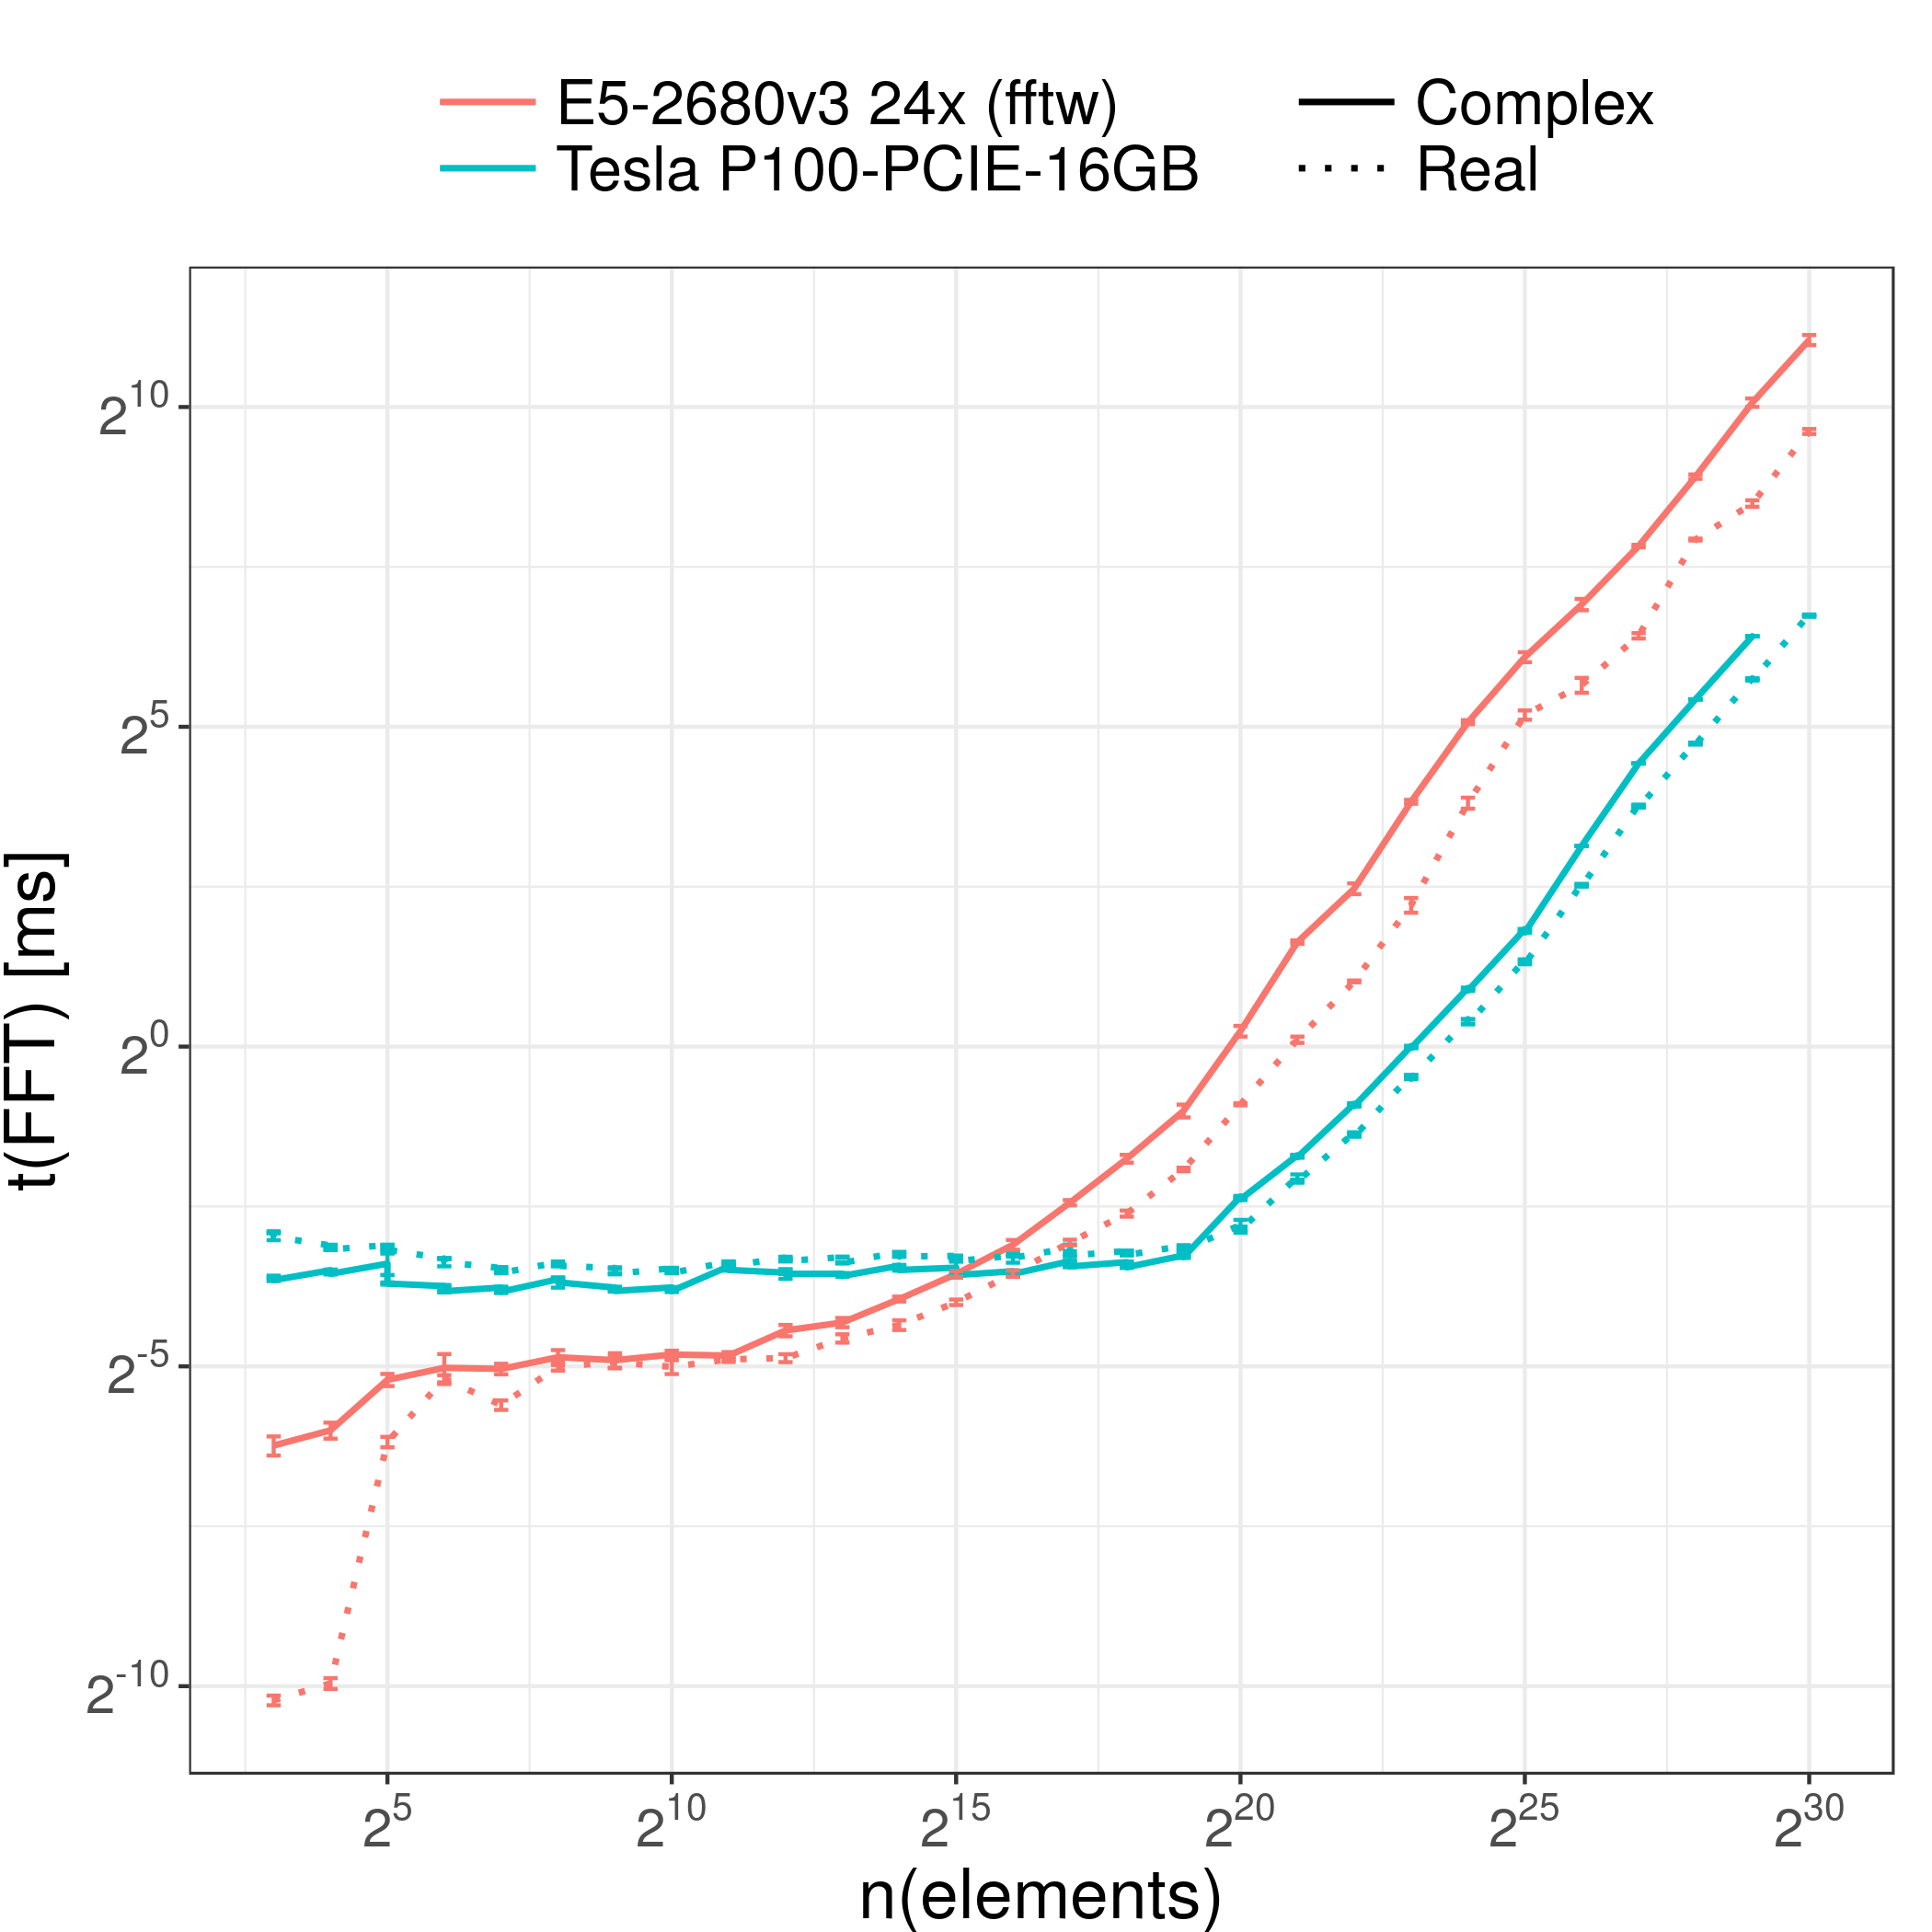
gearshifft FFT benchmark
- co-authored with TU Dresden
- note the variances!
- published at ISC'17
Take aways


Take a balloon:
Use Tools to check the lay of the land.
Falsify the rubber duck:
Profile and check your hypothesis.
Survive the dungeon
With automated ensemble based benchmarks.