The Performance Addict's Toolbox
Thomas Röhl
Thomas.Roehl@fau.de
Peter Steinbach
steinbach@scionics.de
Mar 8, 2018, para//el2018
as simple as this
more like this
Who am I?


HPC group at Regional Computing Center ErlangenProf. Dr. Gerhard Wellein
- support users on our HPC infrastructure
- software and research projects related tonode-level performance engineering
- developer of the Execution-Cache-Memory Model (refinement of the Roofline model)
- tool development
- topics: performance engineering, node-level optimisation
- main developer of LIKWID, a tool suite for performance oriented programmers
The university

Friedrich-Alexander UniversityErlangen-Nuremburg
- ≈ 40000 students
- ≈ 250 majors
- Top3 @ Bavaria, Top 10 @ Germany
Disclaimer

Original talk by Peter Steinbach (Scientific Software Engineer, Scionics Computer Innovation GmbH, Dresden)
Scionics provides data-driven consulting in:- Image Analysis
- Code Optimisation (HPC,Multi-Core,GPU)
- Large Data Life Cycle
- Bioinformatics
Before I begin
All of my slides assume, that the code provides correct results!
Nobody wants fast code, that is wrong!
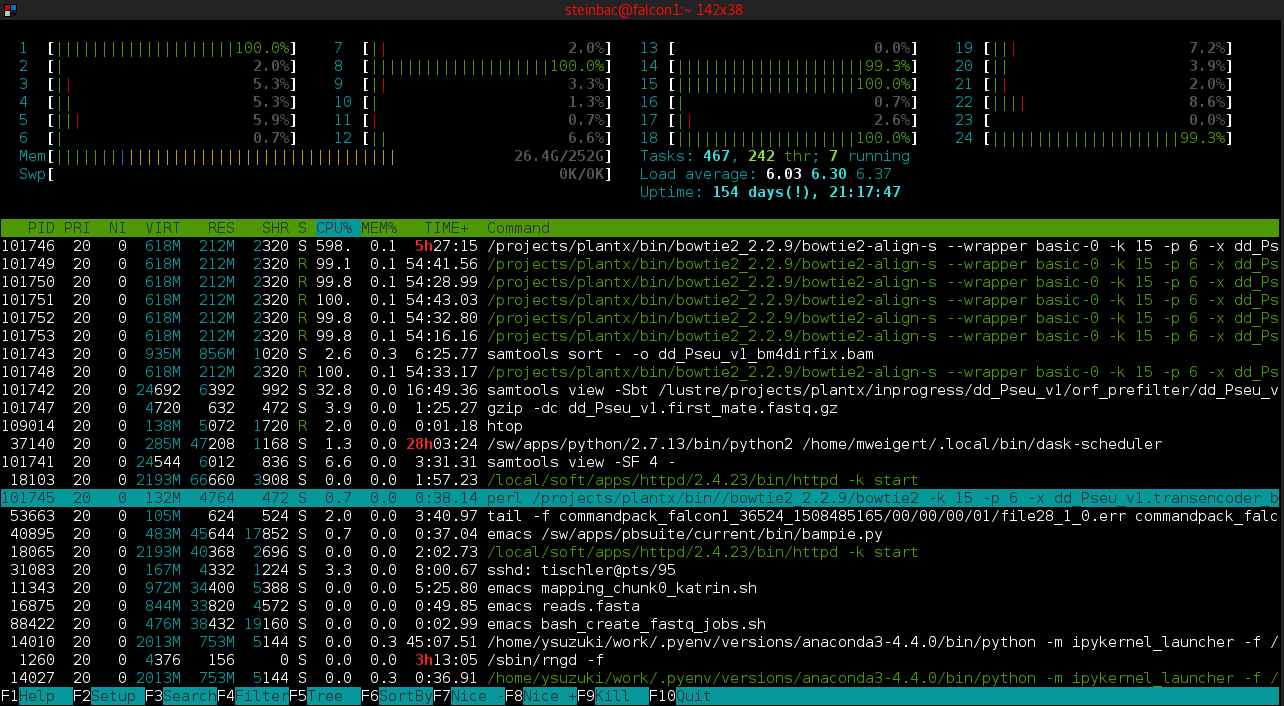
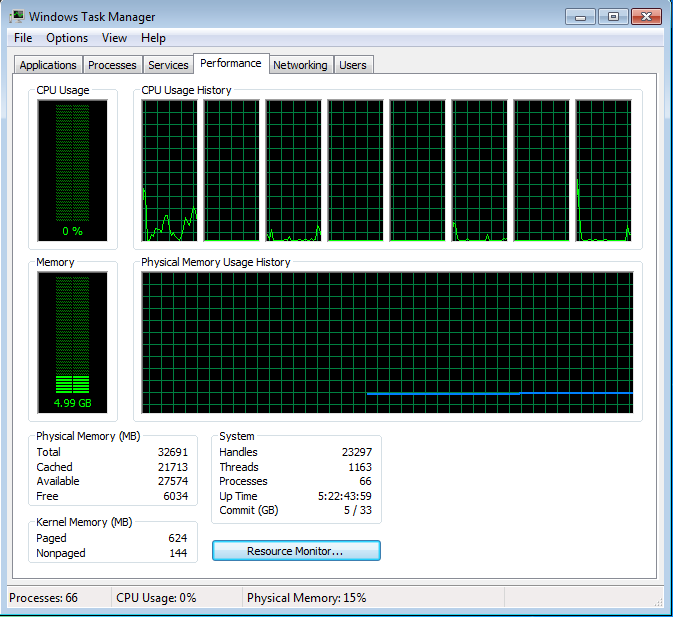
One day as a Performance Engineer

High Level Overview
valgrind + kcachegrind
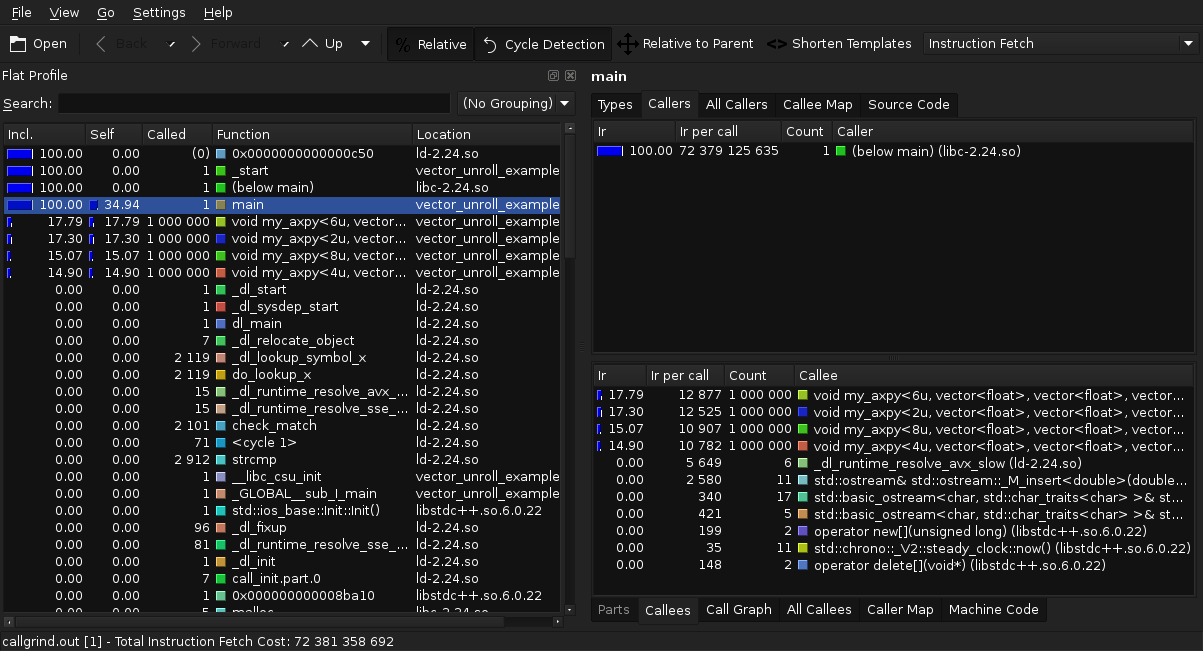
Profile from Peter Gottschling's example on vector unrolling.
Simple Graphical output, perftools
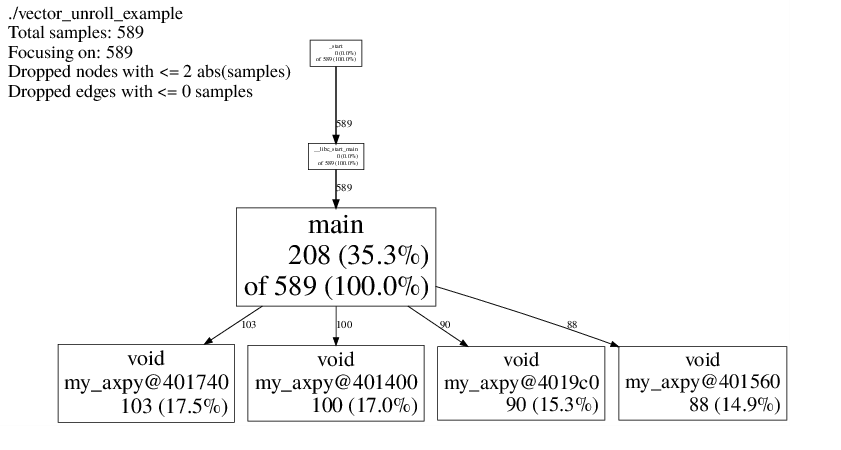
Profile from Peter Gottschling's example on vector unrolling.
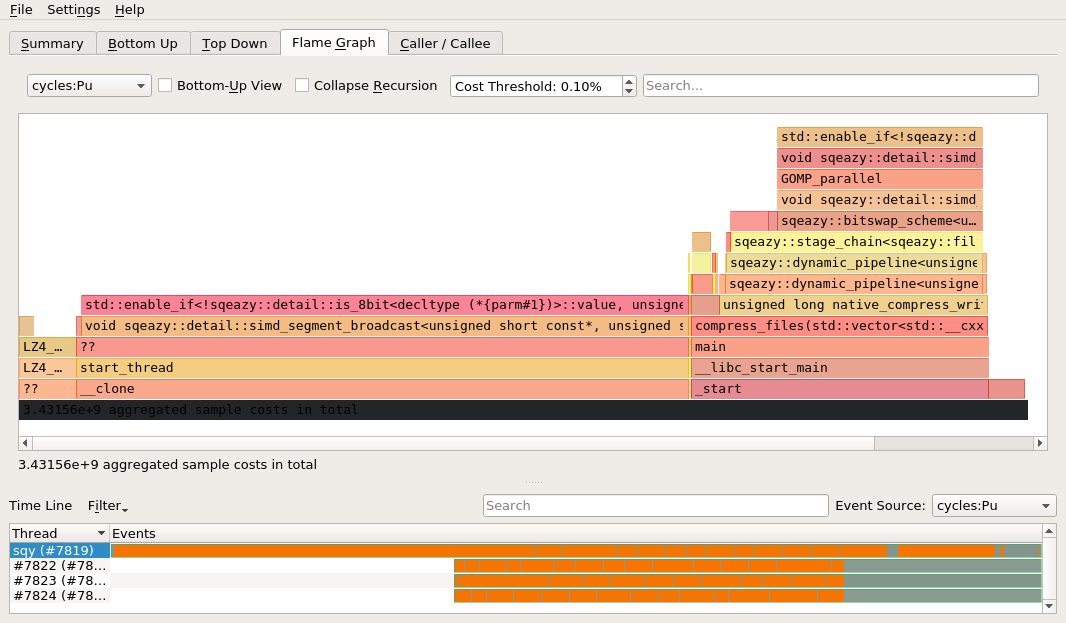
Using flamegraphs, hotspot
Proprietary tools
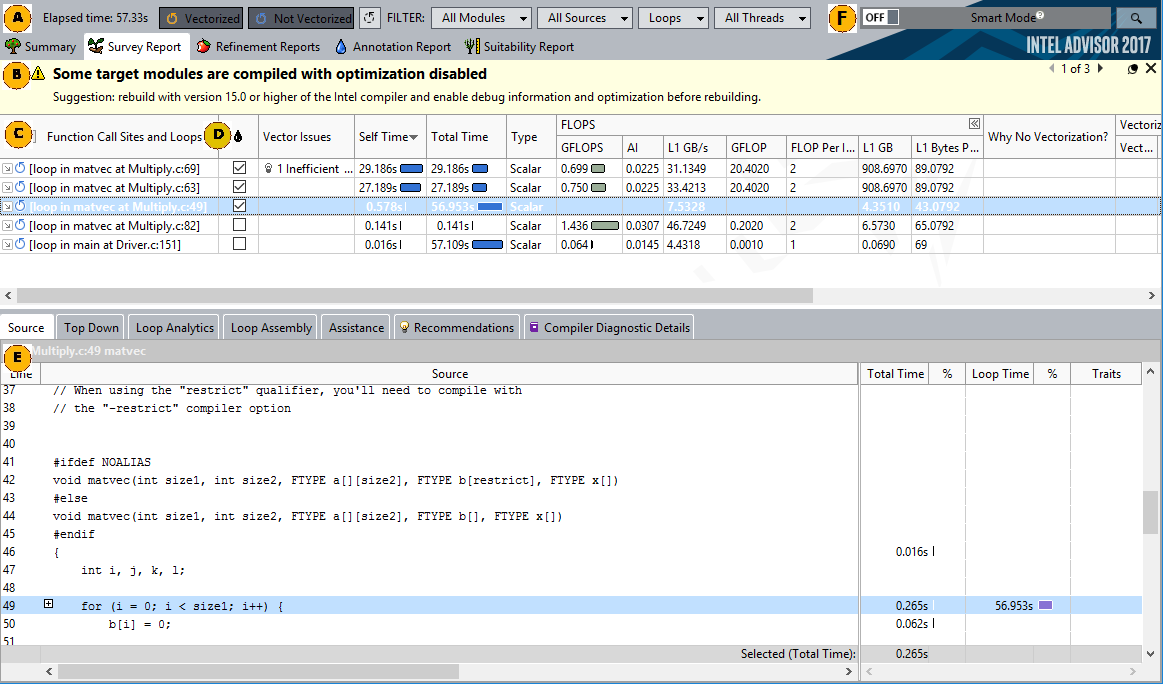
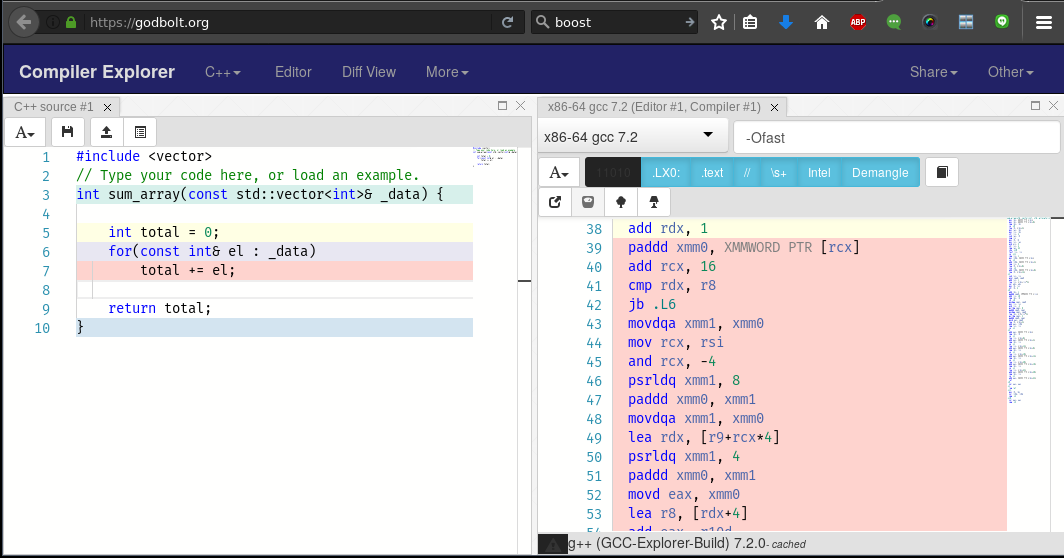
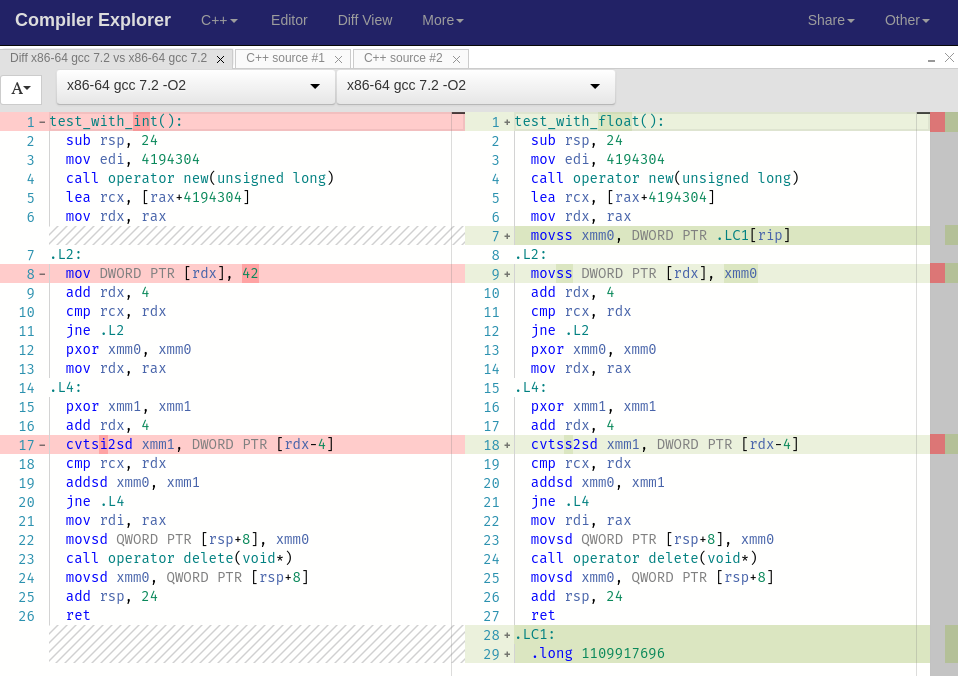
Inspect Assembly?
Test hypothesis with likwid
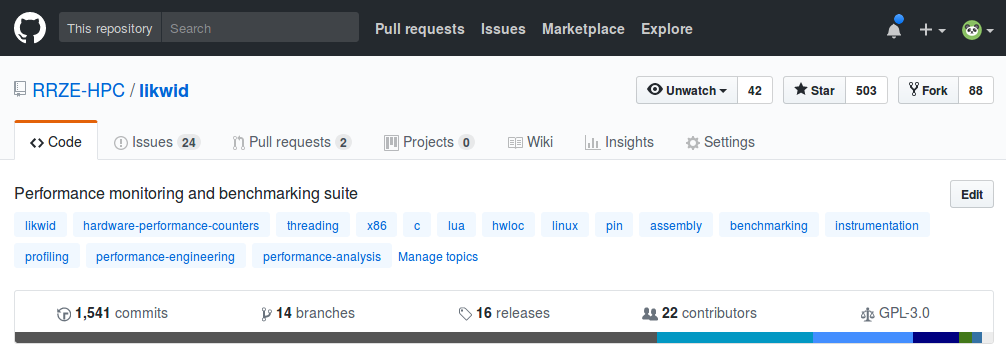
- performance monitoring and benchmarking suite
- exploration through hardware monitoring
- Linux only, GPLv3
- Main focus x86, ARM and POWER upcoming
- profiling hardware counters
(consistent eventset names for portability) - supports almost all provided counters and events
- instrumentation API for C, C++, java and python
Bottom Line
- excellent tools available to find hot spots
- once "found", talk to someone
(rubber duck or colleaque(s)) - create falsifiable hypotheses
- MEASURE!
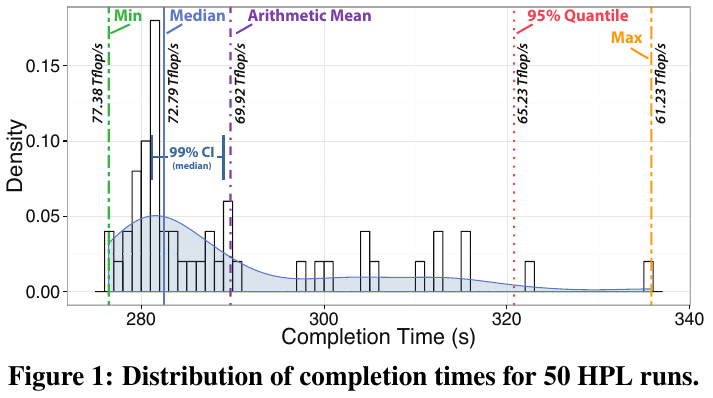
First, take the time
Let's take a toy example
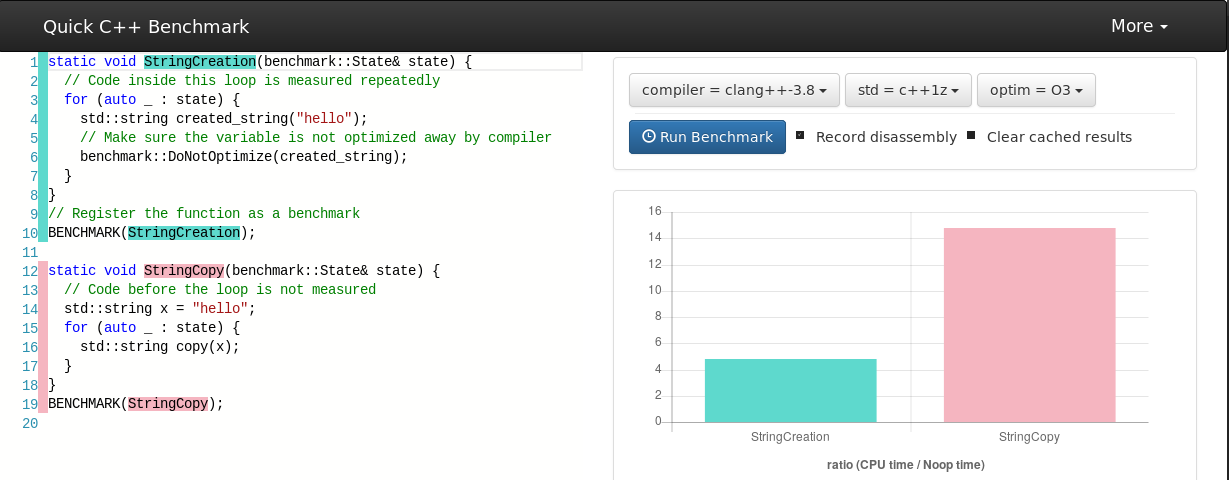
... what if
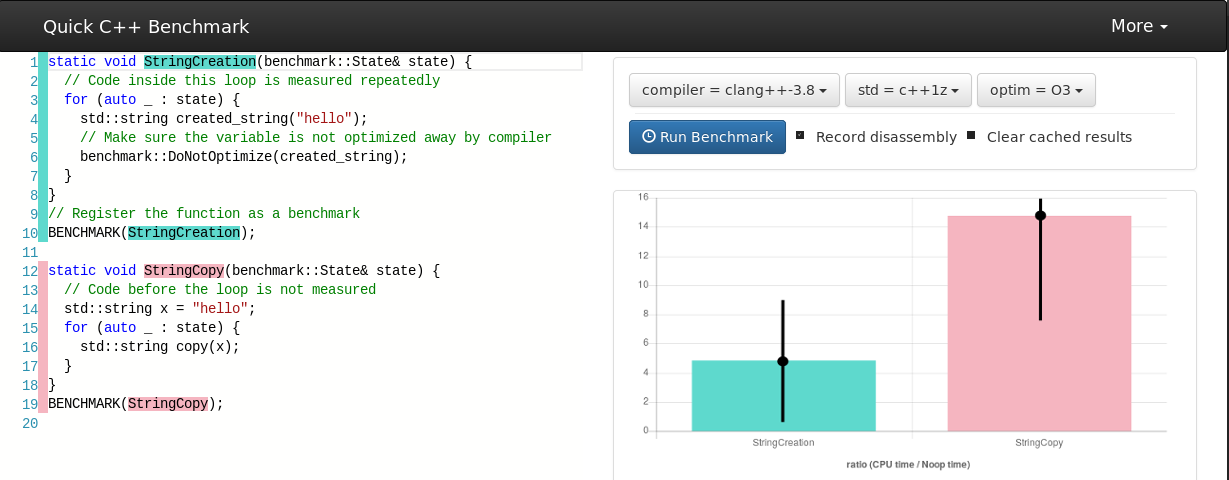
google/benchmark
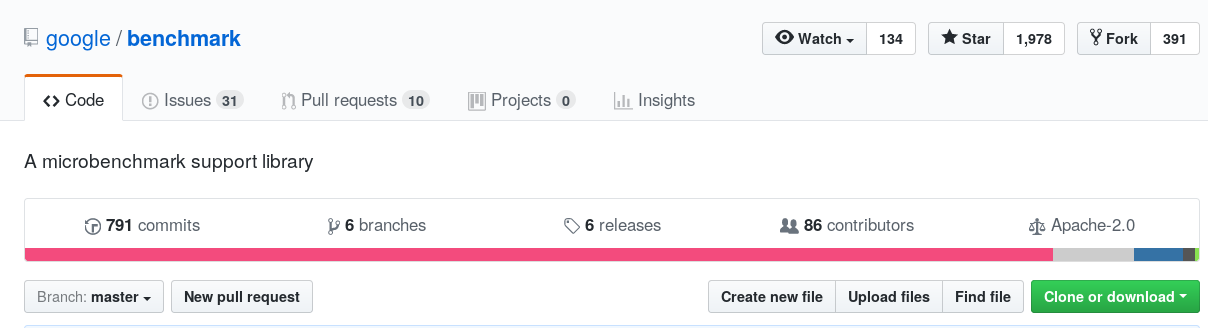
- written in C++11/C++03
- support of multi-threaded applications
- powerful CLI
- easy setup of (templated) test cases
- flexible argument control
- custom counters/timers
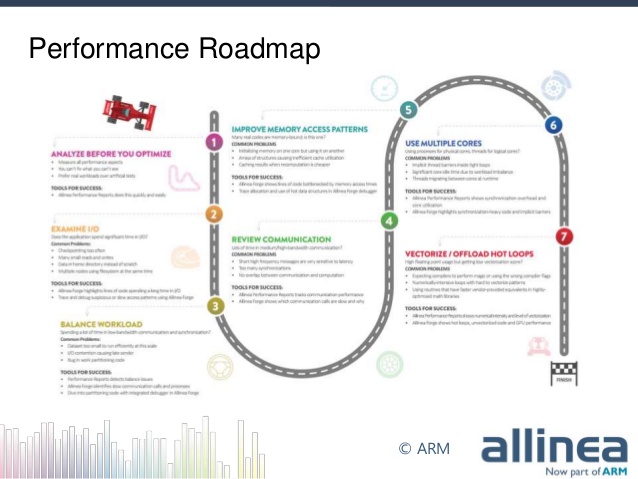
roofline
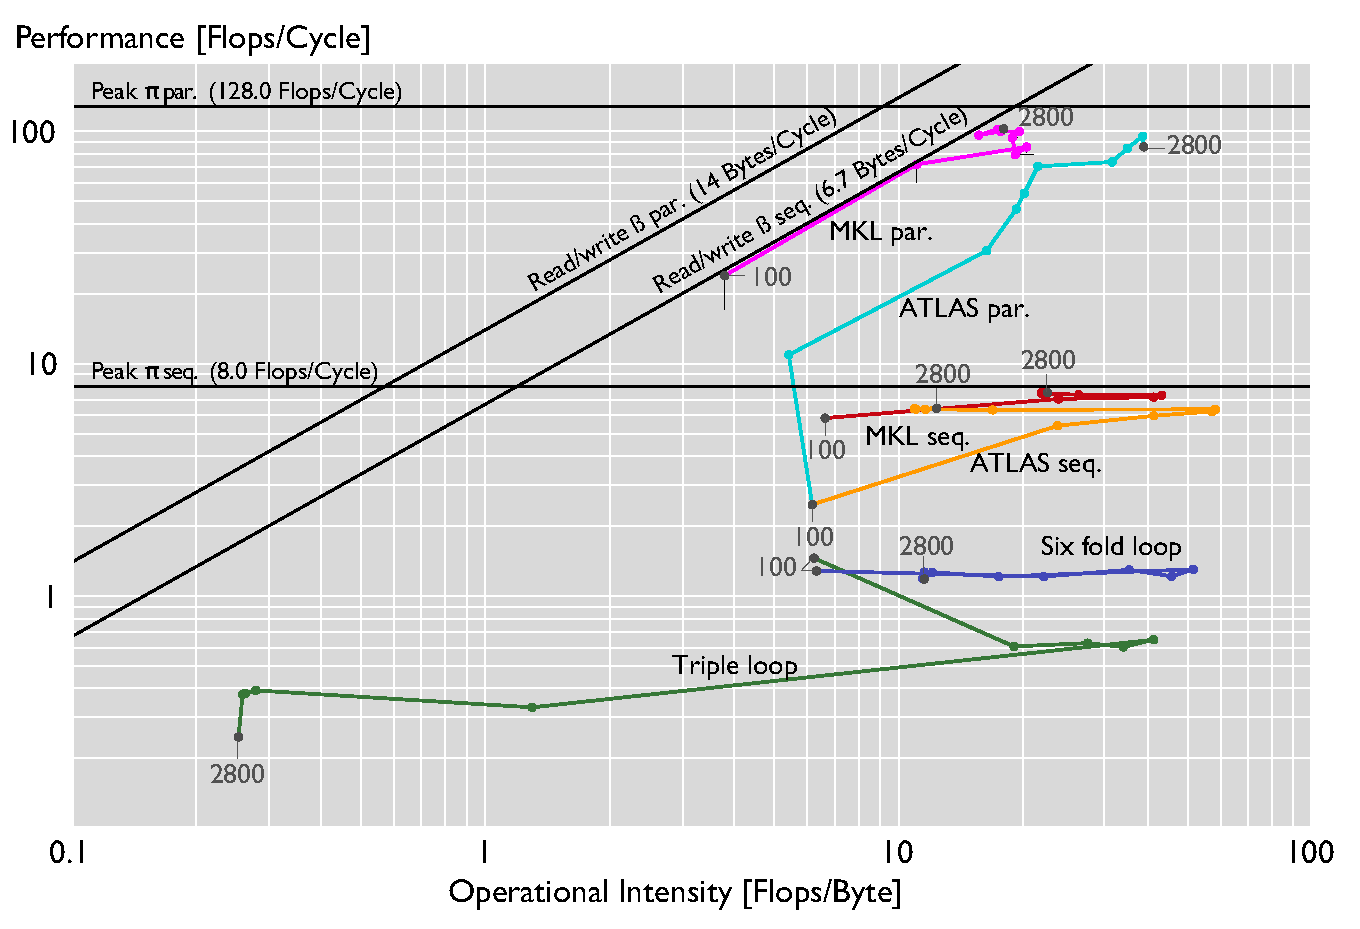
- acknowledge boundaries of algorithm
- differentiate "work" versus "traffic"
- simplistic: bottleneck is either work or traffic
- clear indication where optimisations go
ecm (Execution-Cache-Memory)
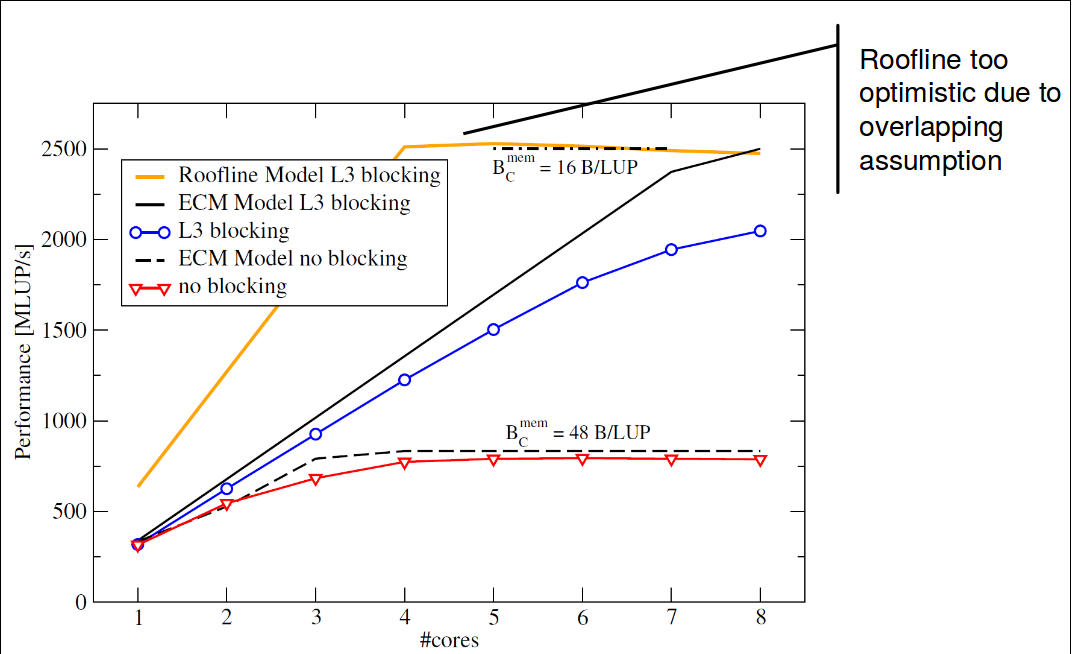
- Roofline does not explain saturation effects
- ECM puts machine characteristics into the model
- some operations cannot be overlapped!
- takes cache traffic into account
Take aways


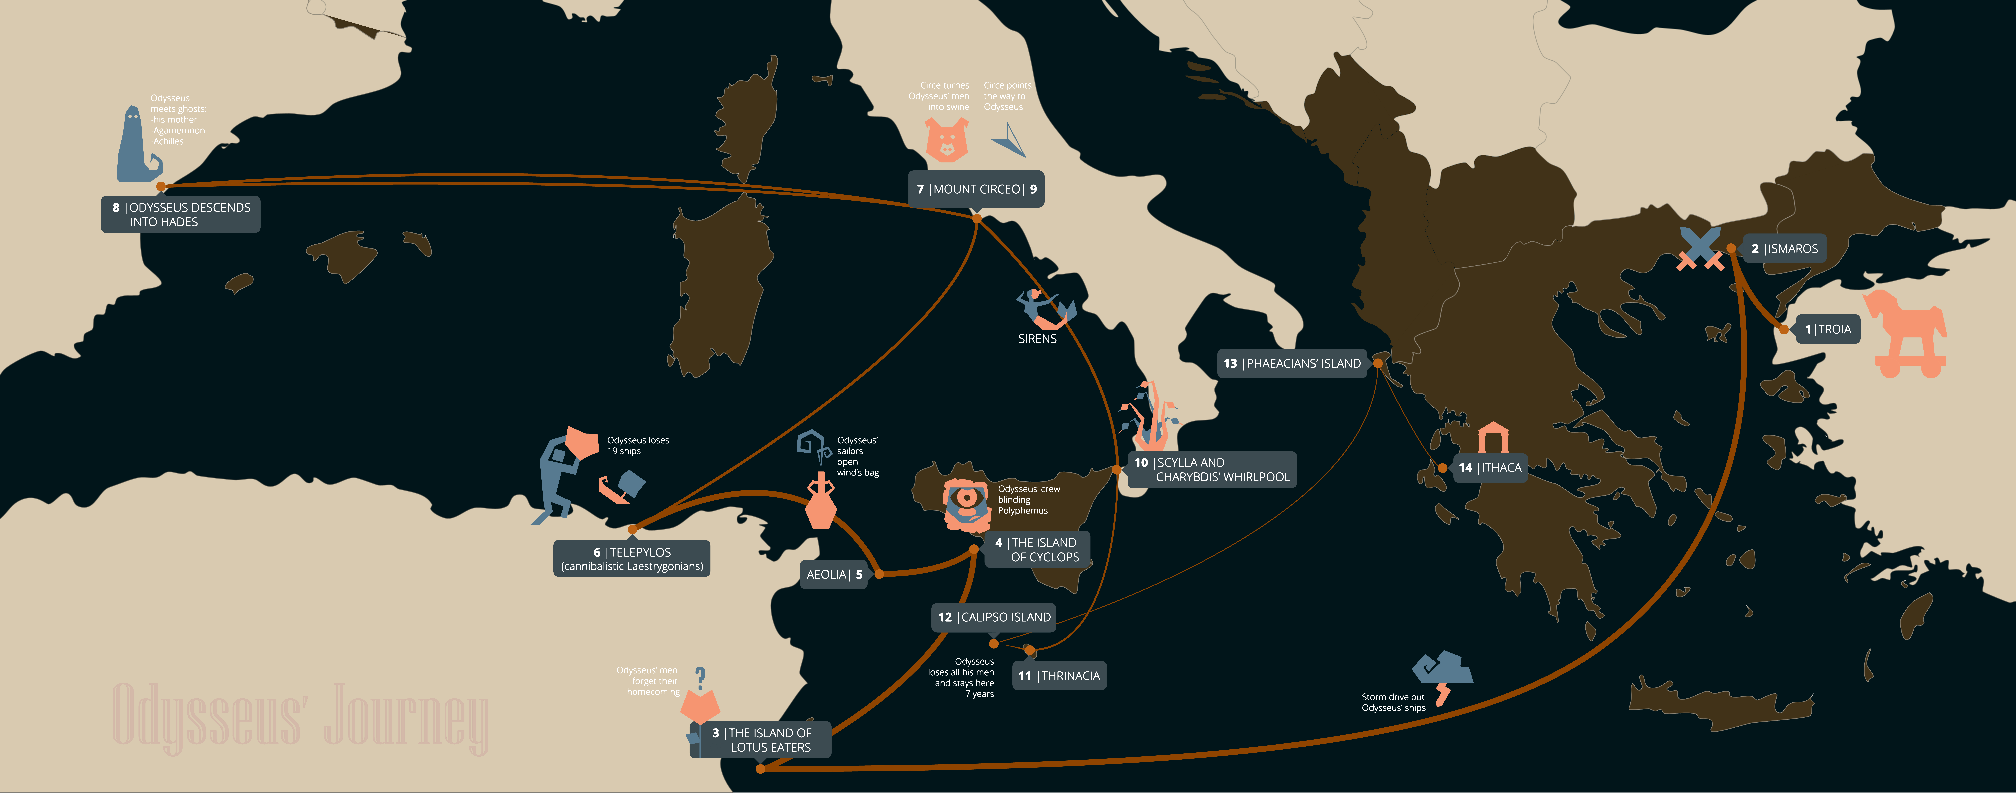
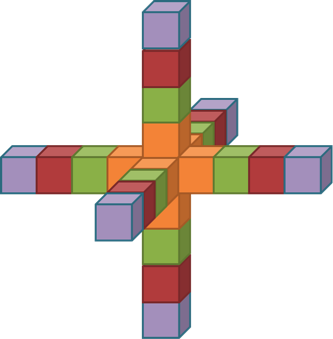
Take a balloon:
Use Tools to check the lay of the land.
Falsify the rubber duck:
Profile and check your hypothesis.
Survive the dungeon
With automated ensemble based benchmarks.
Life as a reviewer
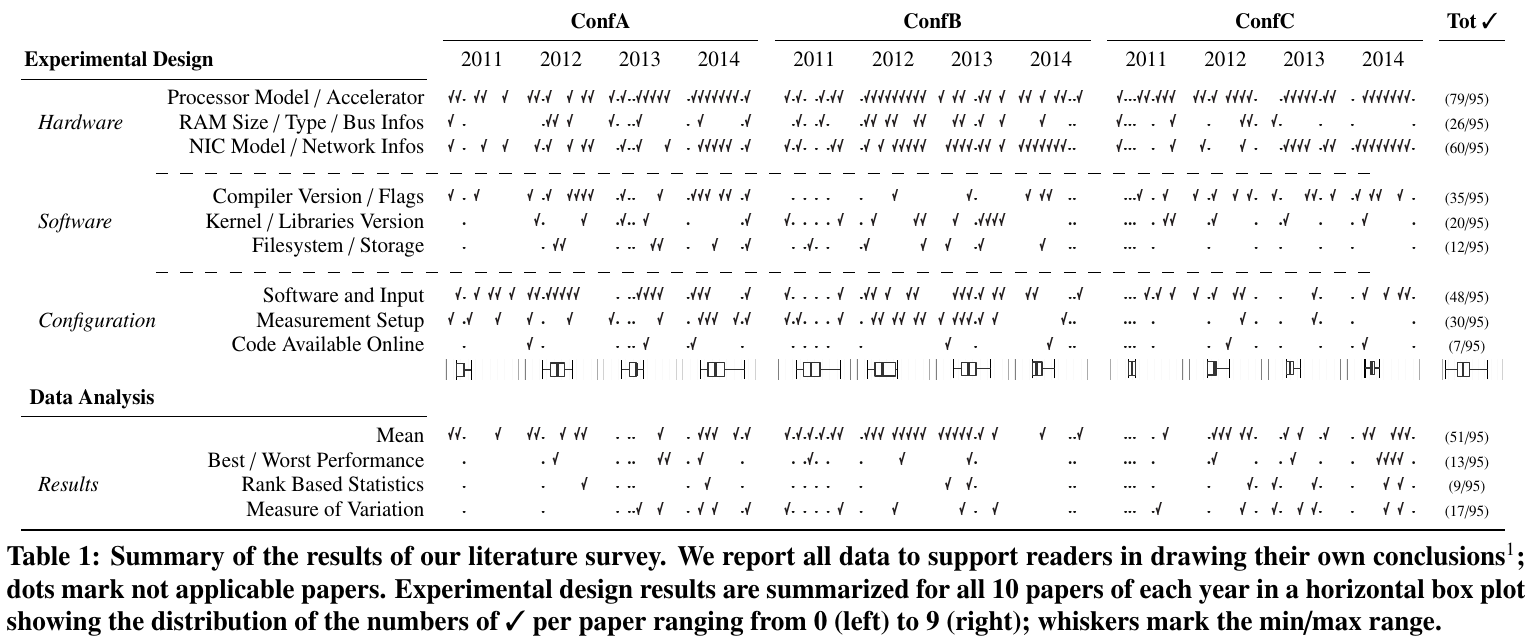
T. Hoefler et al, "Scientific Benchmarking of Parallel Computing Systems - Twelve ways to tell the masses when reporting performance results", SC '15 Proceedings, 2015
Problem also in other fields: AI
Standardized, easy-to-parse output!
T. Hoefler et al, "Scientific Benchmarking of Parallel Computing Systems - Twelve ways to tell the masses when reporting performance results",
SC '15 Proceedings, 2015
Can't this be automated?